Wednesday, 30 September 2009

Advanced Elliott Wave


Hi Everybody..........

This is one for the Advanced Traders among you.........

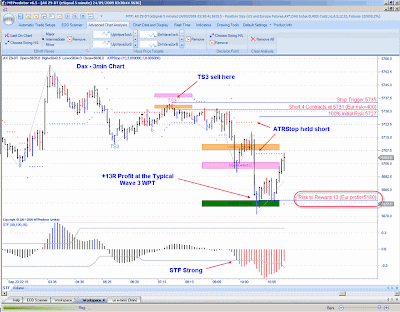
I still find it absolutely amazing how well this stuff works. Just look at this example from this morning on the 3min DAX. A perfect 5 wave decline, with the low right at the Typical Wave 5 WPT. Then an abc rally into the Typical Wave C WPT (and the DP from the prior wave 4 high), before a fall into the lower DP............

This is exactly as outlined in the Trading Course, and here it is unfolding absolutely perfectly right in front of your eyes........... This is MTPredictor at its best - Absolutely amazing !!!

Steve

3min NQ


Sorry to go on about this, but I do find it very annoying when I get emails from people moaning that I have not mentioned a particular losing trade in my posts. I simply cannot include every trade. These post are for education to help you become better trades.

But what annoys me most is the moaners are all too quick to “have a go” at a particular losing trade I did not mention, but “all too conveniently” seem to forget about all the brilliant and profitable trades that I also don’t have time to mention.

Here is a great example on the 3min NQ from yesterday. A DP buy that nailed the low of the day for you. Then Advanced Traders would have used the Elliott Wave module to see that the rally was past the typical Wave 3 WPT so would have started to tail the stop. The result was a nice +4R Profit (ignoring slippage and commission).

So please if you are going to moan, then why don’t you moan about all the good trades that I do not have time to mention :-)

Thanks, Steve

3min YM


OK, now we know that the TS3 buy outlined in the post below was one to be avoided, let’s look at the rest of the day on the 3min YM. I have deliberately chosen to look at the YM because it had some losing trades in, and just to keep all the moaners quiet I will (yet again) talk about losing trades. There are very few Gurus who go out of their way to talk about losses and deliberately choose bad examples to show. This just shows how we are different here at MTPredictor and how we talk about the “good the bad and the ugly” of trading, in others words – the “real” world of trading.

So overall there were three trades, two -1R losses and one +5.6R Profit (ignoring the later TS3 sell because if symmetry reasons, as outlined in the post below), making it a good day overall on the 3min YM.

This is why we have included the history signals in the new MTPv6.5, so you can see all the trades generated. As you all know, I do not suggest blindly taking “all” the trades, you have to filer them using the larger degree trend and pattern (if they look really unsymmetrical).........

Thanks, Steve

Setup to avoid


Hi Everybody,

Today I would like to look at setups to avoid because they don’t “look right”. Yes we have the “symmetry” Filters in the software, but I know that most of you (including me) run with these “off”, so we do need to filter out any setups that look too unsymmetrical, for example the TS3 buy in the afternoon on the 3min YM yesterday.

What do I mean by unsymmetrical ? Well, I don’t like abc patterns where the wave b (in particular) is very very short in time when compared to the Wave a and b. Also a very long Wave a in time when compared to Wave c does not “good look” either.

Also, the trigger bar was 5 bars after the turn. I have mentioned before that I like trades to be filled on the bar or bar +1 after the turn, so 5 bars after is a bit late.

Combine this with the horrible symmetry and that is why this TS4 buy was one to be avoided as it did not “look good”.

Thanks, Steve

Tuesday, 29 September 2009

+6R Profit on the FTSE


For the Standard Traders among you, there was a very nice TS3 buy setup that results in a +6.5R Profit (ignoring slippage and commission) on the 3min FTSE yesterday. This was automatically found and then managed using the Standard setups and standard trade management guidelines.

Yes, there was a -1R loss first, bit this was small when compared to the +6.5R Profit on the second attempt at the low.....

Thanks

Steve

The DP continuation trade


Hi Everybody,

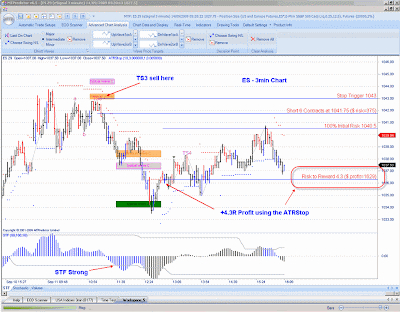
As the name suggestion the Decision Point is a point where the market makes a “decision”, sometimes it is a reversal, but sometime it is a continuation. But the nice thing is that when it is a continuation we very often get a chance to enter a trade with a small controlled risk. Yesterday was a perfect example of this on the 3min ES.

Yes, this is a more Advanced setup but it is covers in detail in the Trading Course, so I suggest you all re-read that part to make sure you don’t miss out on great setups like this +5R Profit (ignoring slippage and commission) on the 3min ES from yesterday

Thanks

Steve

Monday, 28 September 2009

Don’t judge a book by its cover..


Here is a closer look at the second one.......

Once you have placed the analysis on the second history signal, can you see how this was not stopped either. What happened is that we had a “double top” with the next bar. But the first short trade was not stopped out.....

What this meant, is that this was a successful and profitable trade at +3.8R (ignoring slippage and commission). This is why I wanted to go through this today, to show how the history signals are “filled” and not failed trades, so sometimes a history signal can actually be a nice profit, as in this example.

So at “first” sight” the two history signals and the one TS3 buy “may” have looked not to be too god, but in reality these resulted in a -1R, then a +3.8R trade for a nice +2.8R Profit overall.

So my advice is – Do not judge a book by its cover, we allow the analysis to be placed on the history trades so you can see how they would have unfolded.....

Steve

Don’t judge a book by its cover..


Here is a closer look at the first one.......

Once you have placed the analysis on the first history signal, can you see how this was not stopped out as the second TS3 buy came in. This was because the second trade was actually an “equal low” with the first one.

So in reality, although there are two signals here, there would have only been one trade. Yes it was a loss, but as usual that loss was kept small at just -1R

Steve

Don’t judge a book by its cover..


Hi Everybody,

This is good advice and applies to MTPredictor as well as all walks of life. Let me show you an example on the 3min ES from Friday.

If you look at the chart, at “first glance” there are two history signals and one TS3 buy so it “may” look like there were more losing trades than there actually were. Again I refer you to the help video where I explain fully that our history triangles are “filled” trades and not always “failed" trades.

So let’s look at these in a little more detail to show what I mean....

Steve

Friday, 25 September 2009

+12.6R Profit on the 5min Dax


Hi Everybody,

Yesterday I looked at a massive +13R Profit on the 5min Dax, where you had to be an Advanced Trader to squeeze that last R profit from the trade. But it is sometimes a lot easier than that. Today I would like to look at a Standard TS4 sell setup that unfolded yesterday, again on the Dax, that made another massive profit, this time +12.6R, but the difference is that it was managed using the standard trade management guidelines.

As you can see, this TS4 sell nailed the high on the Dax perfectly, the Dax then collapsed, but (and here is the important point) as the STF exceeded its strength band all the standard traders among you would have swapped to the ATRStop. This held the short until eventually being stopped out for +12.6R Profit (ignoring slippage and commission). But again, this was made just using the standard trade management guidelines

So the European traders among you have been having a great time with two +12R trades in just the last two days !!

Thanks

Steve

Thursday, 24 September 2009

FOREX – JPYUSD 60min Chart


Hi Everybody,

I was asked this morning about FOREX and MTPredictor, well here is a lovely TS3 sell that has just reached the first WPT profit target on a JPYUSD 60min Chart.

Notice how we have automatic Position Sizing in MTPredictor for standard ($10) mini ($1) and micro ($0.1) Forex contracts ....

Steve

Dax short – Part 2 (5min Chart)


As we have already seen, when the Typical Wave 3 WPT was reached the profit as +13R (ignoring slippage and commission), and +13R is a massive profit so needs to be protected. This is why I always look at profits in “R” units so you know “how good” profits are at any point. Even just on this chart we already “know” that when a market reaches the Typical Wave 3 WPT that this is the “usual” place where a Wave (3) type swing will end, so the move is started to get near an end. But were there any “other” reasons to suspect the decline was nearing an end..........

Yes, as you can see, using the Elliott Wave module, a wave (5) decline as found, but (more importantly) the low was at the maximum Wave (5) WPT. Also, on the 15min Chart, the Dax had reached an important DP support level (not shown) ........

So here were 3 different reasons that a low as coming in, so it make perfect sense to look to protect such a huge +13R Profit at this point. Again, this is for the more Advanced Traders among you, but do you see how you have the tools in MTPredictor to be able to evaluate the market fully at this time to then make an informed trading decision.

Steve

Dax short – Part 1 (5min Chart)


Hi Everybody,

Today I would like to look at a TS3 sell on the 5min Dax and show how the more Advanced Traders among you can make trade management decisions as different levels are reached.

As you can see, this was a brilliant TS3 sell that nailed the high before the Dax declined sharply. As the STF strength band was exceeded, the standard trade management guidelines said to swap to the ATRStop. At this point I must say that it would have been very tempting to take off at least partial profits at the VSA high volume spike that came in as the short reached the Typical Wave C WPT for a very nice +7R Profit. But I want to look at the “decision” you had as the Typical Wave 3 WPT was reached, when the profit was nearer +13R !

For those of you using just the ATRStop, you still would have banked a very nice +6R Profit, but this post is about squeezing out a little more for the more Advanced Traders among you...........

Onto the next post and next chart.

Steve
PS, I have the wrong title in the chart, it was a 5min chart and not a 3min.... sorry

Wednesday, 23 September 2009

3min YM part 2


Just for completeness, as I know some of you moan if I only show a good trade. But please remember, this Blog is not designed to be a “track Record”, I mainly show examples that are designed for training purposes to teach you all how to trade better. And I do show losing trades as well as winners.....

But to keep the moaners quiet let’s take a look at the rest of the 3min YM Chart yesterday. Although I don’t suggest taking all the trades, there were two other trades, a TS1 buy earlier in the day and a TS3 sell later in the day. Worst case these would have been two -1R losses, which is still a lot less than the one +4.5R Profit, best case they were break-even.

Thanks, Steve

PS, again for the moaners, I have not even mentioned the NQ in which there were some good and profitable trades yesterday, so yes I don’t always mention some potential good trades either. But of course, when you moan, you conveniently forget about all the good trades I don’t have time to mention either :-)

3min YM


Hi Everybody,

Well, it was not long before a nice trade came along, as you can see, the 3min YM gave us a beautiful TS3 buy – that nailed the very low of the day for you ! That resulted in a nice +4.5R Profit (ignoring slippage and commission). The Standard Trade management guidelines swapped to the ATRStop as the STF strength band was exceeded.

But the point is how this +4.5R profit was much larger than the two -1R losses on the ES form yesterday, small losses and big profits, this is the key to long term trading success....

Thanks, Steve

Tuesday, 22 September 2009

3min DAX - Advanced


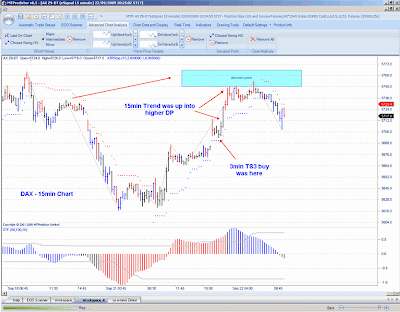
Then, and this is a perfect example of when to use the DP on the shorter time frame, can you see how the 15min rally stopped right at DP support.

So let’s now look at the 3min and we can see a perfect VSA high volume spike sell, this nailed the very high of the day for you !

All of these tools are available in the new MTPredictor v6.5 which has real-time capabilities as is launched today !

Steve
PS, yes you ignore the TS4 buy later as this was now "aginst" the new 15min down trend.....

15min trend


Yes, I know, you are all asking – “how did the 3min buy fit in with the larger degree 15min chart?”

Well, as you can see, “very well” is the answer as the 15min trend was strongly up (in DP resistance) at the time of the 3min TS3 buy

Steve

3min DAX


Hi Everybody

As we have seen many times before, just because the US e-minis are in a quiet part of the natural trading cycle, other markets are not. For example this beautiful TS3 buy on the 3min DAX this morning.............

+7R Profit (ignoring slippage and commission) using the ATRStop..........

Steve

Yes losses can unfold.


Hi Everybody.

First please re-read the post below, where I say “so what should we be starting to prepare for after a good (and very profitable) few days ? “ Exactly a few losses. As we all should know by now, this is just the natural Cyclical Nature of Trading and is how Profits and Losses unfold in the “Real World”. So don’t say that I did not warn you that a few losses were overdue .......

As you can see, the 3min ES had two losing trades, as shown by the history triangles in the new MTPredictor v6.5. BUT, and this is the important point, these losses were kept small at just -1R each, so -2R is a lot smaller than the +6R Profit that was possible on the ES the day before. And that is the key to successful trading, keeping the losses small (not avoiding them).

Again, unlike most Gurus and software vendors, we do show and talk about losses !

Thanks

Steve

Monday, 21 September 2009

3min VSA sell


This was an absolutely perfect example of the high volume (VSA) trade setup. Notice how the VSA bar was a break of a very obvious level (this is what I look for) and then how the DP nailed the high perfectly. And all of this on Stochastic divergence (not shown). As such this was a perfect and brilliant example of the VSA setup, and why it was such a good one to consider a “stop and reverse” from the 5min long trade.

The ES then declined nicely for a nice +3R Profit (ignoring slippage and commission)

Thanks

Steve

PS, after a slow start this was a good end to the week. Yet another perfect example of the Cyclical Nature of Trading, so what should we be starting to prepare for after a good (and very profitable) few days ?

5 and 3min together


This is for the more Advanced Traders among you.

What happens if you are in a 5min trade and you get a good looking opposing trade on the 3min ? For example the TS4 long on the 5min ES, when a lovely VSA sell appear on the 3min ?

Well, this is where you keep an eye on “correlated markets”. We have already seen that the 5min YM had already made its first target, and you were already sitting on +3R profit on the 5min ES long, so (and this is for the more Advanced Traders among you), yes (and only if the new setup is good enough) you can consider stopping and reversing.

Thanks

Steve

Don’t forget the 5min Charts


Hi Everybody,

I have said this before, but please don’t forget the 5min Charts, as there are some great setups on these, for example the lovely TS3 buy on the 5min YM on Friday (there was also a TS4 buy on the 5min ES at the same time).

As you can see, the YM then rallied off this low to reach the first projected profit target for a nice +3R Profit (ignoring slippage and commission). We used the WPT target as the STF was weak.

So the lesson here, is even if you mainly follow the 3min Charts, don’t forget the 5min ones as 5min chart very often give you some nice tradable setups :-)

Thanks

Steve

Friday, 18 September 2009

A great +6R Profit on the Russell


Hi Everybody,

Isn’t the Cyclical Nature of Trading amazing ! Here we are, after a few hard days, then we get a beautiful TS3 sell on the 3min Russell Index. The reason I liked this one over the YM was because the ABC pattern was a lot more symmetrical.

As you can see, the Russell declined sharply from the TS3 sell (which nailed the very bar of the high !) Once the STF strength band was exceeded we swap to the ATRStop, which held the short trade until it was stopped out for a very nice +6.3R Profit (ignoring slippage and commission).

This particular trade was why I designed MTPredictor in the first place, to look for the ABC correction “inside” a larger degree wave (2) (look at the 5min for this), off which a strong Wave (3) swing unfolds. This is the best trade in the book !!

Steve

Thursday, 17 September 2009

Beware the creeping DP


But, and this is a good example, what of the two DP sells later in the day. Yes these turned out OK overall with a -1R loss followed by a +3.3R Profit (ignoring slippage and commission). However when DP’s are clearly “against” the larger degree trend they have a habit of “creeping”, in other words you can get multiple DP’s that fail. That is why the DP should only be used when you have confirmation of the larger degree trend particularly that you are at larger degree support or resistance. The reason for this is that the DP’s are “trend termination” setups and not “trend continuation” setups, so care is needed with them.

Steve

A standard TS2 buy


Hi Everybody,

To start with, a nice and standard TS2 buy on the 3min NQ. As you can see, this made a nice +2.4R Profit at the WPT target (ignoring slippage and commission).

The larger degree trend was up on the 15min chart, so this was a nice standard trade............

But what of the DP sells later in the day ?

Steve
Wednesday, 16 September 2009

A difficult day part 3


There were some nice trades on the long side in other markets, like the YM and NQ, particularly later in the day, which would have been OK, as the 15min trend had turned up again by then.

But I agree, yesterday was a tricky day.

As we all know, this is down to the Cyclical Nature of Trading, where the good times are followed by harder times when a few losses occur as well as quiet times, before the good times come round again. This is just how trading unfolds in the real world.

Thanks, Steve

A difficult day part 2


So the question is whether the TS3 sell on the 3min ES chart was “in the direct of” the 15min Trend ?

If you look at the chart to the right you can see how the 15min ES had hit DP resistance and was starting to decline. So yes, the 15min trend “at that time” had turned down, so looking for sells on the 3min chart was correct.

What most amateurs do not understand is that sometimes, no matter what our analysis says, the markets does what it wants, that is why we have stops in the market. In this case the stops did their job by keeping the loss small at just -1R

Thanks, Steve

A difficult day


Hi Everybody,

Unlike most Gurus and vendors in the business, I do talk about losses and the hard days, and yesterday was a hard day on the US e-minis. They do happen, all professional traders will tell you this, it is just that most vendors conveniently forget about these hard days!

Anyway, the trade I wanted to look at was the losing TS3 on the 3min ES in the morning yesterday.

Yes this was a -1R loss, but that loss was kept small at just -1R, but the question was whether this was a valid trade. For this, let’s take a look at the 15min Chart

Thanks, Steve

Tuesday, 15 September 2009

15min Dax


As I was looking at the last TS3 buy on the 3mikn Dax, I always see how this “fits in” with the 15min Chart. As you can see, the Elliott Wave module has nailed most of the last major turns on the 15min chart perfectly.

The 3min TS3 buy was actually at the last 15min Wave (4) low, with profits taken at the 15min Wave (5) high. As you can see, this was the top, with the 15min DAX declining sharply into today..........

Steve

3min DAX


Hi Everybody,

This is what I mean about keeping and eye on corrected markets.

Some of you may have been asking whether you would have spotted the manual DP YM trade in the post below, but what if “at the same time” there was an automatic TYS3 sell on another world Indices – the DAX ? Surely that would help add weight to it ?

Exactly, as you can see, in its own rights, this was a nice +5.8R Profit (ignoring slippage and commission), but it also helped “add weight” to your manual analysis using the DP on the 3min YM chart.

Thanks, Steve

Now for the Advanced Traders


OK, as we have seen from the 15min ES, the larger degree trend was up, so were there any possible buy setups for the more Advanced Traders among you ?

Yes, look at the 3min YM chart. Here we had DP support on good Stochastic Divergence. This provided a good support zone. The long trade was then off the blue (buy) bar.

The trade was run to new highs when it ran right into DP resistance. With +5R open profit, it would have been a good idea to look to protect this. The result, a nice +5R Profit (ignoring slippage and commission).

Steve

ES - 15min Chart


Pop Quiz........... 15min Chart

As we can see, the 15min Chart made a Wave C low, with the low reversing right at the Typical Wave C WPT and was starting to rally off this low at the time the 3min TS1 sell appeared. So the 3min TS1 sell was “against” the larger degree 15min Chart.

Normally, and for the standard traders, I would suggest that you pass on these “unless” you have a very good reason to take the trade (or example, the pattern looks perfect, like the ES in yesterdays post), and then “if” you do decide to trade against the larger degree trend, look to protect yourself quicker by using the 100% initial risk guideline.

But generally, it is always better to look to trade with the larger degree trend...

Steve

3min ES question


Hi Everybody.

Pop Quiz...........

Should you have considered the TS1 sell on the 3min ES early in the day yesterday ?

Let’s take a look now at the 15min Chart to see what the larger degree trend was doing at the time

Please remember, although all the filled trades are shown by historical triangles on the charts, it does not mean that you should blindly take them all....

Steve

Monday, 14 September 2009

Now for the Advanced Traders.


So what does that mean for the TS3 short on the ES we looked at earlier, well as you can see, this increased the Profit form approx +4.3R to nearer +5.8R (ignoring slippage and commission)
Please note: This was different to the +15R on the FTSE from last week (which we looked to run) because the FTSE was in free fall and had no “other” reasons for support, the ES did, in that other correlated markets were at good DP support Zones.


Steve

Now for the Advanced Traders.


This is why I always say that the good and experienced Advanced Trader will always do better because they have experience. So today’s lesson is to always keep an eye on correlated markets.

In the Post below we saw how the 3min ES short made a nice +4.3R Profit using the ATRStop, but the experienced Elliott Wavers among you will have noticed that this short reached the Typical Wave 3 WPT. In this type of trade, this was the “ideal” place to look to tighten stops as the decline was probably reaching an end.

But first, were there any “other” reason that a low may be unfolding ? Yes, both the YM and NQ had reached DP support, so were also giving signals that the decline was nearing and end.

OK, back to the 3min ES

Steve

3min ES – for the Standard Traders


Hi Everybody,

OK, let’s start with some standard trade setups on the 3min ES from Friday.

The day started with a perfect TS3 sell setup. (I will say more about this in the next post for the Advanced Traders), but it was a standard TS3 sell. The standard trade management guidelines would then have swapped to the ATRStop once the STF Strength band was exceeded. The result was a nice +4.3R Profit (ignoring slippage and commission)

Please note: as the 15min (larger degree chart) was unclear or even up on Friday, any short trades should have been protected quicker by using the 100% initial risk guideline. This mean that we would have had a -1R loss later in the day (as shown by the history triangle), then a break even (using the 100% initial risk guideline) TS4 sell later in the day.

PS. I know that some of you think that I only show the “good” trades, but in V6.5RT we have the new History Signals, which show “all” the filled trades, so everybody can see all the signals that were filled as generated by the software. In this way nobody can say they we are hiding anything as all the signals are there on the chart for you to see. So on Friday, this meant +4.3R then -1R then +0R for a +3.3R day on the 3min ES “if” you had taken all 3 sells.

PPS. But remember we don’t ever suggest just taking all the trades, they are there for advisement based on the larger degree trend.

Thanks, Steve

Friday, 11 September 2009

5mim YM


Hi Everybody,

Yesterday I looked at a massive +15R Profit on the 3min FTSE and showed how the good traders let their Profits run, that is why we have the ATRStop. But sometimes, markets just don’t want to run as much as on other days, but still good profits can be made. For example on the 5min YM yesterday were this same approach made a nice +4R Profit (ignoring slippage and commission)....

BTW, I hope you all remembered to roll over to the Dec contracts yesterday :-)

Steve

9/11

Hi Everybody,

Today is the anniversary of 9/11, so sometime during the day, save a thought for the friends and families of the victims of that tragic day 8 years ago............

Steve

Thursday, 10 September 2009

+15R Profit on the FTSE


Hi Everybody,

Another good day for the European traders among you, with this massive +15R Profit (ignoring slippage and commission) on the 3min FTSE.

A perfect and standard TS3 trade, including using the ATRStop for trade management as the STF was strong. But the lesson form this is how you must stick with these BIG profits because it is these big winners that make you the money over time. As such bailing out early and missing big profits like this is why so many amateur traders never make it. So the lesson here is let the Big winners run....

Thanks, Steve

Wednesday, 9 September 2009

3min Dax


However, just because the US e-minis are quiet does not mean other markets are............

Here is a lovely +5R Profit (ignoring slippage and commission) that has just unfolded on the 3min DAX

Thanks

Steve

NQ on Sep 8 part 2


OK, let’s move down to the 3min Chart.

Here we had a TS1 sell early in the day, that was stopped out for a -1R loss. Yes losses can and do happen, the trick is keeping them small and under control.

Then, later in the day, just as the 15min TS3 buy was coming in, we had a high volume (VSA) spike that unfolded right at DP support. Yes this is a more Advanced technique, but I have shown it many times before. This nailed the low of the day for you !

It was just a pity that the rally off the low was not stronger, as the ATRStop closed the trade for only a small profit. But +1.5R Profit (ignoring slippage and commission) although small was still larger than the -1R loss earlier. As I have already said, a break-even or small profit on a day when the Cyclical Nature of Trading is in the hard part of the cycle is a good result, remember, this comes on the back of some huge profits last week.

Thanks, Steve

NQ on Sep 8


Hi Everybody,

The US E-minis have been brilliant last week and have given us some fantastic and huge profitable trades. In fact, there have so many profitable trades, that I was unable to look at them all in this Blog. But, as we all know form the Cyclical Nature of Trading, after such a good run, then we are overdue for the hard part of the cycle, and that looks to be what happened yesterday with a tracker and quieter day.

Let’s start by looking at the 15min Chart of the NQ, where a Wave 5 high unfolded almost (within a whisker) of DP resistance as well. That set the trend as down in the early part of the day, until the TS3 buy (ABC) low came in later in the day.

So the 15min trend was down in the first part of the day, then turned up later in the day............... Now, onto the 3min Chart.

Thanks, Steve

Friday, 4 September 2009

SFT Weak – Use WPT targets


Then a bit later, the converse on the 3min FTSE. A weak STF so use the WPT targets.

Here the result was a nice +4R Profit (ignoring slippage and commission)....

Add that to the +5R on the Dax and the European traders have had a good morning :-)

Steve

SFT Strong – Use ATRStop


Hi Everybody,

A great example of when to use the ATRStop this morning after the TS3 long on the 3min DAX, as the STF strength band was exceeded.

As you can see, this resulted in a nice +5R Profit (ignoring slippage and commission)....

Steve

How long part 2 ?


Now compare this to the DP sell that unfolded a little later. This was filled on the very next bar after the high. I much prefer it when the fill is closer to the turn.

Thanks, Steve

How long ?


Hi Everybody,

The 3min NQ yesterday gave us a very good look at how long you should wait after a signal before you get filled. For example the first TS3 sell late morning had to wait 6 bars before the fill. For me, this is too long. I like to see a trade filled within a few bars of the turn. So I would say that the short should not have been taken and the order cancelled after a few bars after the high.

Thanks, Steve

Thursday, 3 September 2009

3min YM


Other markets had some more activity, for example the 3min YM, please see the chart to the right. Remember, on days like this look to play both sides of the market and look to bank profits early, as you are only anticipating a narrow range day with small and choppy swings

Thanks, Steve

The Day after..............


Hi Everybody,

Pop Quiz – what should you expect on the day “following” a wide range day (like Tuesday) ? Exactly – a narrow range and choppy day with small swings. And that is exactly what unfolded yesterday (wednesday).

So how should you trade these types of days? (I have mentioned this a number of time before). Exactly, look to bank profits earlier, and even take both sides of the market (longs and shorts)

On the ES, this meant one nice DP long trade (that nailed the low of the day !) for a nice +2.9R Profit (ignoring slippage and commission)

Thanks, Steve

Wednesday, 2 September 2009

Back to the 3min Chart for the trade


OK, now everything looks good, the trade can be taken, and then managed, on the 3min Chart.

Here we use a break of the low of the red (sell) bar at Wave 2orB WPT resistance to enter the short trade. Notice how the 1min abc confirmation helped us avoid the first red bar at this resistance zone. That is why I always need to look at the lower time frame for confirmation of the lesser degree abc pattern...

As the STF was strong (beyond the strength band) the trade can be managed using the ATRStop. The result was a very nice +10R Profit (ignoring slippage and commission) as the ES collapsed for the rest of the morning......

I hope you have all appreciated a bit more of an “in depth” post today showing you more advanced techniques that can be used with the software :-)

Thanks, Steve

Onto the 1min Chart


Now let’s “look inside” the 3min Wave (2orB) to see whether we can see a abc pattern on the shorter 1min chart. As you can see, this is exactly what unfolded.

I normally do not suggest moving to such low time frames, but as there was no nice setup on the 3min chart by itself, this is one technique that the more Advanced Traders among you can utilize, to find more trade setups.

MTPredictor is far far more than just a set of automatic setups, this is why I am trying to educate you and teach you all about how markets unfold so you can utilize (when appropriate) the more advanced tools in MTPredictor to uncover additional trades.

But please remember, to only consider this is you are an Advanced Trader and there know when (and when not) to perform this kind of Advanced analysis. And remember, the pattern and setup should be ideal and perfect to even consider.

Thanks, Steve

Onto the 3min Chart


OK, now the high was nailed using the 15min 24hr chart the “ideal” situation would have been to get an automatic sell setup. However, that did not happen (unless you went down to the 2min chart), but for the Advanced Traders among you, what is the next best thing to look for after a important top has been made ?

Exactly a Wave (2orB) corrective high.

Sometimes (and this is why it is more Advanced) the minor abc is not visible on the 3min chart so you need to go to a lower time frame to “see” and confirm the abc pattern. I am not saying to trade off the 1 or 2min chart, all I am saying is the Advanced Trader can “look” to see if the minor abc is there and is unfolding as part of the 3min Wave (2orB) correction to then take the trade off the 3min Wave (2orB) correction.

Yes this is a more Advanced trade setup, but good to know about.

Thanks, Steve