Friday 29 May 2009

FTSE 3min TS1 sell


Hi Everybody,

A beautiful TS1 sell on the 3min FTSE that is currently underway............ (no STF filter as against a blue STF)

Standard trade management: As the STF Strength Band is exceeded, swap to the ATRStop for trade management.

Trade still open and currently on +8R Profit (ignoring slippage and commission)

So let’s see how this unfolds...........

Steve

NQ – 3min Chart Part 4


For the Advanced Traders among you.

As you can see, the NQ did make a decline into the DP support zone at 12:21EST, BUT the second decline into this zone, that unfolded at a minor DP support with a blue (buy), was the one that interested me the most. The reason for this was that not only did we have double DP support at this level (12:54EST) but it was also on Stochastic divergence. As such, this represented a good buying opportunity.

The trade could have been managed using the ATRStop which would have results in a nice +8R Profit (ignoring slippage and commission), Or the more Advanced Traders among you could have tightened stops as the larger degree DP resistance zone was reached for a +10R Profit (ignoring slippage and commission). Either way, this was a nice setups and one that has been covered in part 2 of the Trading Course.

Thanks, Steve

NQ – 3min Chart Part 3


For the Advanced Traders among you.

Answer: It is the DP from the Prior Wave (4) low

So form a Trading perspective, you should watch the market carefully as the market reaches this DP support zone to see if you have a potential Trade setup. The “ideal” is when the market makes a 3-swing ABC decline into this DP support zone, but other potential setups include minor DP support at oscillator divergence or even a VSA high volume spike.

So let’s see what happens....

Thanks

Steve

NQ – 3min Chart Part 2


For the Advanced Traders among you.

As the chart says: What should the Advanced Traders among you “anticipate” should happen after a Wave 5 swing is completed ? But more importantly, where is the anticipated support zone following a Wave 5 high (Hint: This is covered in Part 2 of the Trading Course)

Thanks

Steve

NQ – 3min Chart


Hi Everybody,

In today’s posts I would like to take a look at just the 3min NQ: Where yesterday was an interesting day that started with a losing TS3 sell.

As all professional traders know, loses can and do unfold, but the trick is keeping them small at just -1R.

But, what unfolded a little later in the day is what really peaked my interest

Thanks

Steve

Back now.............

Hi Everybody,

I am back now after a great few days away, I had a great time and I feel that my batteries are now recharged and I am ready for a great summer in which we have lots of great new things planned for you all :-)

Thanks

Steve

Friday 22 May 2009

Holiday time ............

Hi Everybody,

Well it is that time of year when I need a holiday, my last time off was back in January when I hit the snowy slopes of France for a great skiing holiday (the snow was the best in 25 years this year they say !).

I have been working very very hard on the new MTPredictor v6.5 Real-time with our programmer, and quite frankly after many months of 12 hour days and weekend working, I need a rest.

I know you are all waiting patiently for the new Real-time version of MTPredictor, and I can say that we are making good progress, but we are not quite ready for Beta testing yet. Once we enter the Beta phase, I should have a better idea of how much work is left, so that is why I cannot give any potential release dates as yet.

So there will be no posts next week as I am away relaxing and building my energy up for what will be a very exciting summer. We have lots planned and it is going to be very exciting.............

So while I am away I hope you all have great trades and the markets unfold well.....

Steve

Now for the Advanced Traders


OK, now we have seen that support was coming in on the 15min YM chart, so was there any potential trade setups that the more Advanced traders among you could have taken advantage of.........

Well, Yes, as you see, the 3min YM was reversing off the minimum Wave 5 WPT nicely and there was Stochastic divergence at the low. Both of these, “when” combined with 15min DP support were enough for the Advanced traders among you to consider a new long trade.

The result was a nice +5R Profit (ignoring slippage and commission) as the YM rallied strongly into the close

Thanks, Steve

TS3 sell on the 5min YM Part 3


Yep, you guessed it, it is always a good idea to keep an eye on the larger degree trend on the 15mon Chart, so what do you think was the sensible choice when managing your 5min short as an automatic DP buy came in on the 15min Chart.

Exactly, look to tighten shops and look to exit the short trade earlier.

Thanks, Steve

TS3 sell on the 5min YM Part 2


Well, for those of you who follow this Blog regularly will remember that when a target is far away, because of the prior swing being very long (usually due to a big gap opening), you should check the 24hr session as well.

Well, as you can see, the 24hr chart had a very different picture with the low coming in at the first target for a nice +3R Profit.

But were there any other reasons to suspect the decline from the TS3 sell on this 5min chart was nearing an end (hint: 15min Chart)

Thanks, Steve

TS3 sell on the 5min YM


Hi Everybody

I received a few questions recently on what to do when the first target is a long way off and there are “other reasons” (15min Chart) that you suspect a move may be nearing an end, even though it has not reached the first target.

A good example is on the 5min YM yesterday where we had a TS3 sell, see chart to the right.

Steve

Thursday 21 May 2009

3min ES Short Part 3


And as we can see, the result would have been a slightly higher profit of nearer +5.7R (ignoring slippage and commission) as the ES continued its decline into the close..

Steve

3min ES Short Part 2


Well, as always we look to the larger degree trend using the 15min Charts

And here we can see how the 15min ES was declining form DP resistance and still had further to decline before 15min DP support was reached. Therefore the Advanced Traders among you could have decided to let this short “run” a bit further on the 3min Chart to fall in line with the 15min Chart.

Steve

3min ES Short


Hi Everybody

A good day on the US minis yesterday. So (yet again) this is a good example of the Cyclical nature of Trading, because after a few harder days we come back with some nice good profits. This is how trading unfolds in the real world, do not expect to make profits each and every day, the markets simply do not work like that.

Anyway, I was asked a question yesterday on how to manage this TS4 short on the 3min ES. As you can see, at the first target it as on a nice +2.9R Profit. As the STF strength band had not been exceeded (only just) the standard guidelines say to use the WPT targets and as such Bank a nice +2.9R Profit.

But what of the Advanced Traders among you ? Well then we look to the 15min chart for the larger degree trend....

Steve

Wednesday 20 May 2009

High volume VSA spike Part 2


As this was such a good setup I want to take a closer look.

For me, I love it when we get a break to new highs or lows, breaking an important prior high or low. And I particularly like it after a long choppy period when most amateur traders are frustrated. A sharp move to new highs or lows then occurs on high volume. BUT (and this is the important part) this break immediately fails, and usually fails right at our DP zone.

This failure to continue the move to new highs or lows is a classic “fake out” by the professional traders. It works best on horrible days like yesterday when it catches out all the amateur traders in the wrong direction.

The reversal from this failure usually results in a nice quick profit as the market quickly moves in the opposite direction trapping all the suckers who took the break. That is why it is often called a “fake out” or “sucker play”.

Thanks

Steve

High volume VSA spike


Hi Everybody,

After a very choppy and frustrating day on the 3min ES we got a perfect example of our high vol, VSA, spike trade setup late in the day. As you can see from the chart the high unfolded at 2 DP’s (as well as a 15min DP, not shown), on nice stochastic divergence. As such this was a great example.

The ES then declined nicely into the close for a +6R Profit (ignoring slippage and commission)

It just goes to show how patience and discipline is needed in trading. It would have been so easy to get frustrated as the ES was just chopping sideways in a narrow range for most of the day, so you could have given up and gone home. But if you had then you would have missed this good profit at the end of the day.

Thanks

Steve

Tuesday 19 May 2009

Lloyds Bank Daily Chart


Hi Everybody,

I am often asked about the best way to trade shares, do you just trade them “in isolation”. I would say no, the best way is to always have an eye on the main Indices. So this Wave C low that unfolded on Lloyds (UK Bank) on March 9 was a perfect candidate to consider as it fell perfectly in line with the potential low on the FTSEE100 on Mar 9 (post below) as well.

As you can see, Lloyds has rallied nicely to reach the DP zone where a profit of approx +8R (ignoring slippage and commission) was available.

But the point is how the setup on the individual share also “fell in line with” the position on the Index.

Thanks, Steve

Daily FTSE100


Hi Everybody.

A few user have asked about the position of the FTSE100 (UK Stock market) on a Daily Chart.

So please take a look at the chart to the left, where we can see how the DP nailed the low perfectly on Mar 6. And since then the FTSE has rallied very nicely. It is always nice to nail the very day a major turn unfolds

But what now, well although we are at the “initial target” form the low (DP from the last minor high) because the weekly chart has put in a Wave 5 low (not shown) I suspect that this will only be a minor high. But we will have to wait and see how the next few weeks unfolds.

So for now the position is that we have made a very important low on Mar 6.

Thanks, Steve

Some days are hard


Hi Everybody.

You have heard me talk about the Cyclical nature of Trading a few times, well yesterday was a brilliant example of how we are now in the harder part of the cycle, which has come after a few good days on the US e-minis. As such a hard day yesterday should have come as no surprise.

There are too many amateur traders who expect everything to work out perfectly each and every day, this is not how the real world works. Trading is about probabilities and sometimes you can do all the analysis you like that points to a high (like on the 15min Russell yesterday, which was at DP resistance early in the day) for it to decide otherwise and the rally continue. Does this mean you have done something wrong, not at all, it just means that we are in the hard part of the cycle.

Trading is not about “predicting the future” it is about making money, and sometimes there will be losses or hard days. It is your job to either not trade when the picture is unclear or take the losses but keep them small (-1R) so you are ready for the good days when the big profits unfold.

Again, this is just the natural way trading unfolds. So to become a professional trader we all must understand this and accept it. There are too many Gurus who do not have a clue about real trading, who simply do not understand this, so many newer traders get fed misinformation by some Gurus. So when they come to us, and we tell it like it is in the real world, it comes as a bit of a shock. So that is what this daily Blog is all about, to tell it like it is, the Good, Bad and the Ugly, to help you prepare for how to tackle trading in the real world...

Thanks, Steve

Monday 18 May 2009

OK, but what of the nice TS4 sell on the 3min Russell


OK, so far I have suggested that the YM was better than the Russell at around 10:40EST on Friday. But what if you prefer to trade the automatic setups and are uncomfortable with manual analysis ?

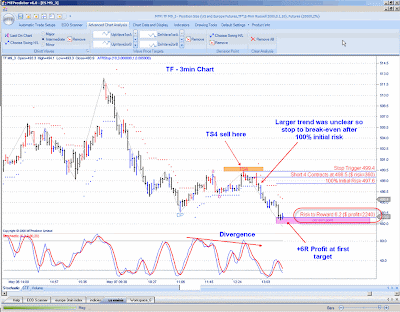
Well, this is why we always suggest that you follow all 4 minis (ES, NQ, YM and TF), because (as we have seen) the YM (and the NQ) was making a possible high, so if this was correct then all 4 minis were likely to follow each other down. So with this in mind you could have considered the TS4 sell that unfolded on the 3min TF at the same time.

Yes, this was not ideal, because the 15min TF was not clear, but do you all see how because you were anticipating a decline on the market as a whole it was OK. Please note, if you are at all uncomfortable about this kind of “correlated markets” analysis, then don’t take the trades, This is more of an “educational piece” for the more Advanced Traders among you to show you what you can do with more experience. All I would say, is that if you are unsure about a trade, then bring the protective stop to break-even faster to protect the trade.

Thanks, Steve

3min YM manual DP sell...


OK, now we have decided that the YM was in a clearer and more obvious position on the 15min Chart, lets move down to the 3min chart and see what we get.

Well, at 10:42EST the 3min YM was also at DP resistance and as such the Advanced Traders among you had a potential manual DP sell setup. As you can see, this was the high of the day off which the YM declined nicely.

Once the STF strength band was exceeded (after reaching the opposing DP) the ATRStop was used, this resulted in a nice +6.5R Profit (ignoring slippage and commission) .....

Thanks, Steve

The larger degree trend Part 2


In the 15min Russell Index chart (post below) the picture was very unclear, but now compare this to the 15min YM (chart to the right) and I hope you can all see how the picture was a lot clearer, with the 15min YM reversing off DP resistance mid morning.

So what would common sense tell you to do if you have a clear picture on the YM but not on the Russell ?

Exactly, pass on the Russell and focus on the YM for shorter term trades.... so let’s take a look at the 3min YM in the next post

Thanks, Steve

The larger degree trend


Hi Everybody,

Today I have some good examples that will help with many questions I get on a regular basis, and that is what to do when the larger degree trend is unclear ? As such I do suggest you read all of today’s entries to follow the examples though.

A good example was on Friday, so let’s start by looking at the 15min Russell Index chart ?

As you can see, the picture is not clear at all with no obvious DP support or resistance zones off which the markets is reacting.

Now compare this with the 15min YM chart in the next post (above)

Thanks, Steve

Friday 15 May 2009

5min YM


Hi Everybody

After a tricky start we did get a nice manual DP sell towards the end of the day on the 5min YM. As this was a manual trade, it should, be consider more of an Advanced setup. As you can see from the chart this was also on a VSA high volume spike as well as on STF divergence (not shown).

Also, the reason I liked this setup is that it was “in line with” the 15min chart that was at 15min DP resistance.

As you can see, a +3.8R Profit (ignoring slippage and commission) was a nice end to what was otherwise a boring day....

Thanks

Steve

What to do when the pattern is unclear...

Hi Everybody

Most of yesterday was a hard day especially as the picture was not clear as the US e-minis dipped down though DP support and then drifted higher. So this does raise a good question – what do you do if the pattern is unclear ? Well, as I say in the Trading Course Part 1, the pattern on most markets will be unclear about 50% of the time, so this is something all professional traders will need to handle on a regular basis.

Common sense should step in here and tell you that when the pattern is unclear, you should do nothing. It is always best to only works with the clearest patterns. This is something I teach and mention regularly in my training webinars as well as outline in the Trading Course

Again, this is where we are different, here at MTPredictor, in that we deal with the realities of trading, and show you how to handle situations like this which will come up regularly.

Thanks

Steve

Thursday 14 May 2009

3min FTSE winner


Hi Everybody,

It was not all doom and gloom yesterday, there was a very nice +12R Profit on the 3min FTSE, please click on the chart to the right, that I had a good look at in my training webinar (MTP customers only) yesterday. Here we saw how it was a good idea to look to “run” this short into the Typical Wave 3 WPT target on the 3min Chart, because this “fell in line” with what the larger degree 15min Chart was saying.

This is where the additional training of the MTPredictor customer webinars comes in. As you can see, a purchase of MTPredictor is not just the software, it includes lots of additional training as well, as we wish all our customers to get the most from the software......

Thanks

Steve

Again, Losses are important to include


Hi Everybody,

Again, I must stress how important it is to realize that losses can and will unfold in any trading. Too many Gurus just do not mention losses, and that annoys me. Anyway. After a couple of good “Gap Opening” plays over the last few days it was no surprise that one yesterday did not work, please see the chart to the right on the 3min NQ. But, and this is the important part, this loss was kept small at just -1R, which is small when compared to the Russell Gap open play of +6R Profit yesterday. This is the secret to successful trading, keeping the losses small (not avoiding them) and the profits large.

Otherwise, yesterday was a hard day on the US minis, which should come as no surprise, especially after such a brilliant few days recently. I hope you all remember the cyclical nature of trading :-)

Thanks

Steve

Wednesday 13 May 2009

Continuing from the post below.


Ah, I hear you all say, nice to call the day’s low, BUT what of the “larger degree” trend, what was this saying as the 3min Wave 5 low was coming in ? A good question, so let’s take a look..........

Well, as you can see, the 15min ES was right at DP support “as” the 3min Chart was making its low, so this was a perfect example of how the 15min Chart was working in harmony with the 3min, and as such allowed the Advanced Traders among you to nail the very low of the day yesterday.

This is the power of MTPredictor, once you learn how to use it and as such can use it’s techniques and modules correctly, And that is what I aim to show you on a daily basis ion this Blog :-)

Thanks, Steve

Nailing the day’s low on the ES


OK, here is one for the more Advanced Traders among you.

If you look at the 3min ES chart you can see how (at the very low of the day) the 3min ES made a wave 5 low (as found by the Elliott Wave module in MTPredictor). But what interested me was how this wave 5 low was at the minimum Wave 5 WPT and was on good Stochastic divergence (not shown on chart) and was also on a VSA high volume spike (not shown on the chart) so was an “ideal” place to look for a low to unfold.

As you can see, the ES rallied into the DP (from the prior minor Wave 4 high), but the STF strength band had been exceeded, so time to swap to the ATRStop for the trade management. This held the long as the ES rallied sharply, to end with a massive +10R Profit (ignoring slippage and commission).

What a nice trade, and this is a great example of yet another day when MTP has nailed the very high or low of the day for you.

Thanks, Steve

Losing Trades


Hi Everybody,

I think it is important to remind you all that there will be losing trades. This happens with all systems and all approaches. But there are too few Gurus or software vendors that never mention losses, so new and amateur traders find them hard to deal with. But we at MTPredictor are different, and I will talk a lot about losers in this Blog.

Losses can and do happen, but the important part is that they are kept small, at just -1R loss, so even if you have 1, 2, 3 or even 4 in a row (which can happen), then just one +6R profit (like the Russell trade below) will then put you back in profit overall. This is why it is so important to use correct Position Sizing, to keep the inevitable losses small and Profits large.

Lastly, when you are new to trading, it may be better to reduce your initial risk, to 1% for Futures and Forex, and 0.1% for Stocks, in this way the drawdown’s will be smaller for you initially...

Thanks, Steve

Gap Open play on the Russell Index


Hi Everybody,

If you remember a couple of days ago I talked about a “Gap Opening” play where we look for a market to make a move into a DP within the first few bars of the trading session, usually after a Gap Open. Well, this is exactly what happened on the Russell Index yesterday, where the 3min Chart bumped up into DP resistance, where a red (sell) reversal bar unfolded. The market then declined straight into the “opposing DP” when you should have started to trail the stop just above the bars high to protect the profit.

The result, a nice +6.4R Profit (ignoring slippage and commission).

Yes, this is an Advanced trade, but I did cover it just a few days ago, so it should have been fresh in your minds

Thanks, Steve

Tuesday 12 May 2009

One for the Advanced Traders........


OK, the 3min NQ did rally later, but I hope all the Advanced Traders among you noticed that this rally unfolded as a 5-wave pattern,. Then a reversal started to unfold right at the Typical Wave 5 WPT which was also right at the DP. And all of this on Stochastic divergence as well.

As such, this was a good short for the Advanced Traders among you.

So looking back, MTP was able to nail both the low of the day and the high of the day on the NQ – not bad for a days work :-)

Thanks

Steve

What about the TS3 buys later ?


OK, I know you are all going to want to ask about the TS3 buys that unfolded on the 3min NQ a little later on.

Well, you should all be able to answer this for yourselves, because we have just seen how the 15min chart had just reached larger degree DP resistance and was now declining. So what was the “larger degree” trend at this time ? Exactly – down.

Yes, I know the NQ did rally later in the day, but trading is all about what you knew “at the time”, and yes, ,markets will go in the opposite direction than anticipated sometimes, this is just trading. Successful trading is not about trying to “predict” the future movement correctly, it is about Risk control, keeping your losses small and your profits large. This is something most Amateurs traders simply do not understand, you don’t have to “predict the future” to be a successful trader....

Thanks

Steve

OK, let’s now move down to the 5min Chart for the actual trade entry.

As you can see, this had you long from the low of the day (which is always nice for a day trade). The target is then the “opposing DP”.

The result, was a very nice +11R Profit (ignoring slippage and commission). Not a bad start to the day :-)

Steve

Gap open play on the 5min NQ


Hi Everybody,

The first thing you should do each day, before the open, is to look at the larger degree picture (on your 15min Chrats), so you are “prepared in advance” for larger degree DP’s.

If you had dome your homework yesterday, then you would have know that the initial gap down on the NQ landed right at 15min DP support, please see Chart to the right.

The Advanced Traders among you should all know my “gap opening” play, which is where you look for a trade after a gap opening that then starts to reverse at DP support or resistance. Well, this is even stronger if it unfolds at larger degree DP’s as the NQ did yesterday.

So let’s now look at the 5min chart, for the actual entry.......

Steve

Monday 11 May 2009


OK, here is the 3min ES chart.

As you can see, the market just meandered higher (just as the 15min Chart suggested), but (and this is the important part) there were no abc corrections off which we could have got long.

Amateur traders simply do not understand that you need not trade every day to be successful. They see a move, then want to be in it, with no regard to risk or discipline. This is why amateurs fail. Successful trading is all risk control and having the patience and discipline to follow your plan and wait for the ideal setup. And some days that does not unfold.

So again, it is days like this that build the patience and disciple that is vital if you wish to succeed and become a professional trader....

Steve

15min ES on Friday


Hi Everybody,

The ES on Friday was a perfect example of how traders need patience as well as discipline.

After a good day on Thursday, Friday was quiet. Why do I say this ? Well, (as usual) lets set the larger degree trend with the 15min Chart. As you can see, the 15min ES was up off the DP and Wave C low the prior day. So you should have been looking for buy setups on the shorter term 3 and 5min Chart during Friday.

So let’s see what unfolded in the next post......

Steve

Friday 8 May 2009

Education, Education, Education.....

What most amateur traders don’t realize is that to become a good trader takes time, effort and therefore experience. But it is such a sad world we live in now, that so many rubbish internet vendors nowadays promise untold riches with little or no effort. For all of you out there with any common sense you should know that this is stupidity. In this world you have to work at anything to become good, and you have to become good to do well. That is just a fact of life. That is why I am doing this Blog, to help you all become better traders and as such be able to make the best use of MTPredictor and its routines.

As you have seen, when the routines in MTPredictor are applied with experience, they can uncover some great trades. In particular, the automatic routines are not designed to be followed blindly, (a computer by itself will never to as well as a human being), so they are designed to “alert” you to a “potential” trade, then (as you have seen in all these examples) the experienced trader uses their experience (for example the larger degree trend) to then choose which setups to take. As you have seen, this can uncover some great trades.

I will do my part, by providing lots and lots of on-going examples, to help you learn and become more experienced, all I ask in return is that you take the time and make the effort to learn from them...........

Thanks, Steve

What of the larger degree trend


OK, I hear you ask – what of the larger degree trend when the 3min TS4 unfolded ?

Well, this is where Education comes in and is why I am spending so much time each day with all these examples, day by day, on this Blog, to “teach” you all how to read charts better, and as such become better traders.

If you look at the 15min Chart to the right, (click to enlarge) you can see how the 15min Russell was declining of nice DP resistance, so the only question was where DP support should come in. Yes the “initial or minor” first level would be taken from the “last minor swing” into the high, and yes we did get a minor bounce off that level. But the main DP’s should always be taken from the most important prior swing highs or Lows. And in this example this would have given us a main DP still lower.

So with this in mind, the TS4 sell was after a rally off minor DP support, but we still had the main DP level much lower, so a further decline was likely. But (as I said on my post below), because this was not perfectly clear, the advanced trader should have brought their stop to break-even closer quicker.

Thanks, Steve

TS4 sell on the 3min Russell


Hi Everybody,

After the initial decline on the US minis yesterday, a rally unfolded off the lows, but what interested me was how this rally unfolded as a 3-swing ABC. As you all know, I like ABC correction’s.

Yes, the larger degree picture was unclear (i will look at that in the next post), so the Advanced Traders among you could have played this TS4 sell on the 3min Russell a bit more cautious than normal and move the stop to break even quicker than normal (after 100% initial risk had been reached).

The result was a nice +6R Profit (ignoring slippage and commission) as the TF declined into the first profit target

But as a note: Isn’t amazing how the cyclical nature of trading unfolds. Just yesterday I outlined how we have had a few hard days and as such we should be preparing for some good (and profitable) days soon, well that is exactly what we got yesterday. All trading goes in cycles, so once you realize this you will not become frustrated on the quiet days as you will know that some good days will be just round the corner....

Thanks, Steve

Automatic DP on the 5min NQ


Hi Everybody,

This is one for the Advanced Traders among you.

So far I have said that the automatic DP’s should be treated with caution, and as such should only be considered when they “line up” with the larger degree support/resistance zones. But there is one other place where the more experienced or Advanced trader can consider them, and that is after a clear 5-wave swing. Yes, “ideally” this should be a perfect Elliott 5-wave swing, but we have found that all it needs is 5 swings. If you look at the chart to the right, here was a good example yesterday on the 5min NQ.

What I also liked about this was that the sell unfolded in the first few bars of the day, so it was almost one of our “gap open” plays as well.

As you can see, the NQ then declined straight though the first DP target to then find support at the lower DP zone, where a nice +5.8R Profit (ignoring slippage and commission) was available.

Again, this is for the more Advanced traders among you, but it a good example of one of the places when the automatic DP’s can be considered.

Thanks, Steve

Thursday 7 May 2009

The answer.......................


Well, this where common sense and experience comes in, two qualities a purely mechanical system will never have !

First, you must know that you are in the quiet part of the cyclical nature of trading cycle (see post below), so you are not anticipating big profits. This is a mistake many amateurs make, they seem to expect big profits everyday this simply does not happen in the real world.

As you can see from the chart, the TF had reached the level of the prior wave b low, but had not quite reached the DP from this low. Yes the DP is the “normal” first target on a quiet day, but what do you do if you are “almost” there.

Well, I would suggest looking to see if you could lower your stop to lock in at least a small profit, And for this I look for minor swing pivots to use. In the Russell there was one at 0.7R Profit, so this made a good place to lower stops to.

As you can see, this is where common sense and experience can help over a purely mechanical system.

Thanks, Steve

A question on the 5min Russell Index


Hi Everybody,

Although it was a quiet day yesterday, there were a few trades, for example this TS3 sell on the 5min TF (Russell Index). However the trade management was slightly tricky, as the trade was nicely in Profit, but did not reach any of the projected targets,. So what should you do in a circumstance like this ?

Please see the chart to the right to see the position. Sitting on a +3R open profit and almost at the DP from the prior minor low.

Thanks

Steve

The natural cyclical nature of trading.....


Hi Everybody,

It was another quiet day on the US e-minis yesterday, but then this was to be expected. As I outlined earlier in the week, because we have had a very good week last week, we should now expect some harder days and some quieter days. This is just the natural cyclical nature of trading, where the good times are followed by harder and quieter times before the good and profitable times come round again. Your job as a trader during these harder times is to preserve your trading capital so you are ready to take advantage when the good times come round again.

Too many amateur traders get frustrated during these quieter times and as a result start making silly trades, which then frustrates them even more with unnecessary losses, so they then miss the good trades when the come round. By knowing how markets really works, and understanding the natural cyclical nature of trading, you can be ready for these quieter times, and as such know that there will be less trades and also a few small losses. This prepares you to not get frustrated, so you are then ready for the profitable trades again .....

Thanks

Steve

Wednesday 6 May 2009

The Answer............


As you can see from the 15min TF chart to the right, the 15min Chart had just made a 5-wave rally to not only end right at the Typical Wave 5 WPT, but this was also at good DP resistance as well. As such, the recent uptrend was probably ending and a 15min high was now in the process of unfolding....

So if we see a high coming in on the 15min Chart, what direction should we be looking for on the shorter 3 and 5min charts for our actual trades ? Exactly, down, or sells.

Apart from the Advanced Trader (who can use more advanced stop loss strategies), most traders should now be looking for sells, so what do you think the answer should be on our question in the post below on the TS2 buy setup ? Exactly, as this was “against” the new down trend, this was probably a trade that was best avoided (especially by the newer and less experienced traders).

So thank you very much to Tom for this question, it a very good one that we can all learn form.

Thanks, Steve

A question on a Buy setup on the Russell


Hi Everybody,

I would like to start today with a question that I received yesterday, it was whether this TS2 buy on the 3min Russell was a good setup to consider. Please see the chart to the right, also click on the chart to enlarge....

So what is the first question we should all ask ourselves ?

Exactly – what is the larger degree trend........ so let’s take a look at the 15min Chart in the next post.

Thanks, Steve

Tuesday 5 May 2009

After ..............


Here is the result, a nice +5R Profit as the DAX rallied nicely to reach the opposing DP target where a potential +5R Profit was available

Again, this is for the Advanced Traders among you.

Thanks

Steve

Before..............

Hi Everybody,

For the Advanced Traders among you.

Here is a potential setup on the 5min Dax, where we have a VSA, high volume spike, bar that has immediately been followed by a blue (buy) reversal bar at DP support. As such, this is a potential low coming here.

The profit target is the “opposing DP” where a potential +5R is available

So let’s see how this unfolds............

Steve

Daily S&P reaches initial target

Hi Everybody,

Well, after 2 months, the S&P has rallied nicely, and has now reached its initial upside target form the Mar 6 low (which came in right at the DP support zone).

So does this mean that we are now going to make a high, and we should be looking for short trades ? Well, not necessarily, all it means is that we have reached the initial target for the rally from the Mar 6 low.

Thanks, Steve

A hard day on Monday


Hi Everybody,

After a few very good days, yesterday was a lot harder, but then this is just the natural cyclical nature of trading – after a few good days, we were overdue for a harder day with less trades.

Having said that, just before close we did get a TS4 but setup that did make the first profit target for +2.4R Profit (ignoring slippage and commission).

But overall, it was a hard day yesterday on the US minis

Thanks, Steve

Monday 4 May 2009


Also an ABC..........

But here is why I like this 5min YM DP sell, because the pattern was also a 3-swing ABC, and I like ABC patterns :-)

Thanks

Steve

Here is the 15min YM Chart.............


As you can see the 5min DP sell unfolded at the same time as the 15min Chart was giving a TS3 sell. So the 5min DP was “in the direction of” the 15min Chart, so was a good one to consider.

Thanks

Steve

Automatic DP sell on the 5min YM


Hi Everybody,

There were also some nice automatic trade setups on the US e-minis on Friday was well. The one that caught my eye was the DP sell on the 5min YM early afternoon. Normally I am very cautious of DP’s as I always like them to be with the larger degree charts, so they should be more of an Advanced technique. But this was a good one, because not only was it at a 15min TS3 sell (next post) but it was also an nice ABC pattern

Remember, always check the larger degree charts, particularly for the DP setups

Thanks

Steve
DP’s nailing the turns


Hi Everybody,

Wow, what a day on the 3min ES for the DP (Decision Point) on Friday. If you look at the chart to the right (click to enlarge) you can see how the DP tool in MTPredictor managed to nail virtually every high and low throughout the day on Friday............

Steve