Monday 14 September 2009

Now for the Advanced Traders.


So what does that mean for the TS3 short on the ES we looked at earlier, well as you can see, this increased the Profit form approx +4.3R to nearer +5.8R (ignoring slippage and commission)
Please note: This was different to the +15R on the FTSE from last week (which we looked to run) because the FTSE was in free fall and had no “other” reasons for support, the ES did, in that other correlated markets were at good DP support Zones.


Steve

Now for the Advanced Traders.


This is why I always say that the good and experienced Advanced Trader will always do better because they have experience. So today’s lesson is to always keep an eye on correlated markets.

In the Post below we saw how the 3min ES short made a nice +4.3R Profit using the ATRStop, but the experienced Elliott Wavers among you will have noticed that this short reached the Typical Wave 3 WPT. In this type of trade, this was the “ideal” place to look to tighten stops as the decline was probably reaching an end.

But first, were there any “other” reason that a low may be unfolding ? Yes, both the YM and NQ had reached DP support, so were also giving signals that the decline was nearing and end.

OK, back to the 3min ES

Steve

3min ES – for the Standard Traders


Hi Everybody,

OK, let’s start with some standard trade setups on the 3min ES from Friday.

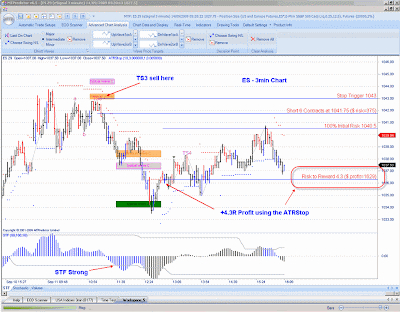
The day started with a perfect TS3 sell setup. (I will say more about this in the next post for the Advanced Traders), but it was a standard TS3 sell. The standard trade management guidelines would then have swapped to the ATRStop once the STF Strength band was exceeded. The result was a nice +4.3R Profit (ignoring slippage and commission)

Please note: as the 15min (larger degree chart) was unclear or even up on Friday, any short trades should have been protected quicker by using the 100% initial risk guideline. This mean that we would have had a -1R loss later in the day (as shown by the history triangle), then a break even (using the 100% initial risk guideline) TS4 sell later in the day.

PS. I know that some of you think that I only show the “good” trades, but in V6.5RT we have the new History Signals, which show “all” the filled trades, so everybody can see all the signals that were filled as generated by the software. In this way nobody can say they we are hiding anything as all the signals are there on the chart for you to see. So on Friday, this meant +4.3R then -1R then +0R for a +3.3R day on the 3min ES “if” you had taken all 3 sells.

PPS. But remember we don’t ever suggest just taking all the trades, they are there for advisement based on the larger degree trend.

Thanks, Steve