Friday 1 May 2009

Perfect Elliott Wave pattern


Hi Everybody,

I still find it amazing when a market unfolds in an absolutely perfect Elliott Wave pattern. Here (on the 3min ES) we had a 5 wave decline (with the low right at the minimum Wave 5 WPT), which was followed by a rally into the DP (form the prior Wave 4 high) that sub divided into a lesser degree abc, with the high right at the minimum Wave C WPT. This is absolutely perfect, and exactly how it is outlined the Trading Course.........

So when you get a perfect pattern like this, you can’t avoid taking the trade.

The result, a nice +3.2R Profit (ignoring slippage and commission) as the ES declined to new lows and then reversed right at the DP support zone.

Yes, this is for Advanced Traders, but when we get patterns as perfect as this, it makes sense to do your homework, study the course so you are ready for days like this. Seriously, it will be worth it, as we have seen the Advanced Trader could have had an extra +5R (+2R on the last post and +3R here) Profit yesterday, so it makes sense to take the time and do the work that is required to become good at this.

But again, do you all see how the tools and modules in MTPredictor v6.0 helped you uncover these patterns with the Elliott Wave and manual DP modules. The tools are in the software, you just have to learn how to use them :-)

Thanks, Steve
Now one for the Advanced Traders


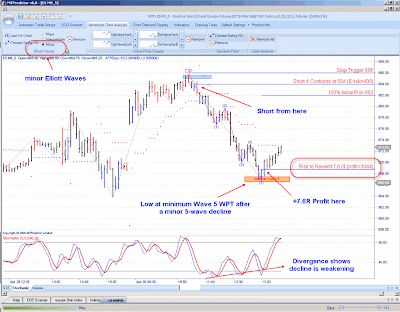
OK, this DP sell on the 5min ES made a nice +5.6R Profit (ignoring slippage and commission) but could the Advanced Traders among you have done any better ? Well, yes, the ATRStop is good, but very often it will get you out late after a turn has unfolded. Knowledge of Elliott Wave patterns can very often get you out nearer the actual turn. This is where the Elliott Wave module in MTPredictor v6.0 comes in.

As you can see from the chart, the decline off the DP high unfolded as a minor 5-wave pattern. As the ES declined into the minimum Wave 5 WPT, the stochastic was showing divergence, signalling that the current down trend was weakening. This was a sign to bring stops closer.

This would have stopped out the DP short (form the high of the day) at nearer a +7.6R Profit (ignoring slippage and commission), adding +2R over the ATRStop on its own.

As this requires knowledge of the more advance tools in MTPredictor, so this is for the more Advanced Traders among you, but it does show you the power of the tools and modules in MTPredictor.

Thanks, Steve

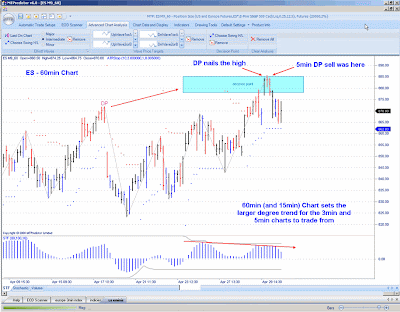
Now what does the 60min Chart say


OK, as always, and especially with the DP’s we must take a look at the larger degree trend. For 3 and 5min Charts I tend to look at the 15 and 60min Charts. This works well on the US minis and European Indices.

As you can see, at the time of the 5min ES DP sell, the 60min ES was right at DP resistance, therefore making the 5min DP sell a good one to consider. And also a good one to look to “run” further than the initial targets.

So the lesson here is always do your homework and always be aware of the position of the larger degree charts, their trend and any DP areas that will affect the short term charts.

Thanks, Steve

3min ES DP sell nails the high of the day !


As we have seen from the YM posts below, a high was coming in at about 11:15EST, banking +2R Profit (ignoring slippage and commission) on the TS3 long. This turned out to be the high of the day ! But wouldn’t it have been nice to sell this high ?

Well, that is exactly what happened on the 5min ES, with an automatic DP sell coming in at 11:15EST as well. Please see the chart to the right. Click on the chart to enlarge. OK, DP’s are nice, but we must always check that they are in line with larger degree DP’s support or resistance, which is what I will look at in the next post.

As the 60min chart was in line with this (next post) it was a good idea to look to beyond the initial target and run with the ATRStop. The result was a nice +5.5R Profit (ignoring slippage and commission)

Thanks, Steve

Here is the same TS3 buy setup that I looked at below, but using the 24hr session for the 3min YM.

As you can see, this had a smaller initial swing into the start of the pattern, therefore lowering the initial profits targets. The result was that the high unfolded right at the first profit target for a nice +2R Profit.

So the lesson here is when you get a big initial gap on the US e-minis, always do a quick check on the 24hr sessions to see if that changes the picture on any current analysis and targets.

Thanks, Steve

Mind the Gap


Hi Everybody,

As you all know, I like to use 9:30EST to 16:15EST for the US e-minis (what used to be the old “day session”), as it has the highest volume. But you can get big overnight “gaps” that you have to be aware of. The TS3 buy on the 3min YM early in the day yesterday was a perfect example. Do you all see how the big gap overextended the initial swing, therefore putting the targets too high for the trade.

When this happens, always check the 24-hr session as well, see next post.

Even if you had not checked the 24hr session, the high did unfold at the DP (from the minor Wave b high), and there were other reasons, see my post later on the ES, why you should have been anticipating a high coming in, so looking to protect profits earlier on this long trade.

Thanks, Steve