Friday, 28 August 2009


And that is exactly what unfolded, just as the Wave 4 low was coming in on the 5min NQ chart, we had an automatic TS3 (abc correction) buy on the 3min Chart. This got you long just before the sharp rally !

Standard traders would have used the ATRStop as the STF strength band was exceeded for a nice +8R Profit (approx and ignoring slippage and commission). But the Advanced Traders among you will have noticed that the rally bumped right into the higher DP resistance zone. At that time you were sitting on a massive +10.5R Profit, so what was the sensible thing to do ? Exactly, look to tighten stops and protect this massive profit....

But do you all see how this TS3 buy was logical and “fitted in” with the 5min chart and as such was one that you all should have caught. And what a brilliant trade it was :-)

Steve

And what usually comes after a Wave 3 ?

Exactly a Wave (4) correction..........

As you can see, this was found on the 5min chart, so time to go back to the 3min chart to see whether this Wave 4 correcting had “sub divided” into a lesser degree abc.,

Onto the next post,

Steve

As I suggested in the chart in the last post, once a market rallies beyond the typical Wave C WPT, then that move should be considered more “impulsive” rather than “corrective”. A quick look at the 5min chart conforms this where the rally is found as a Wave 3.

Onto the next post,

Steve

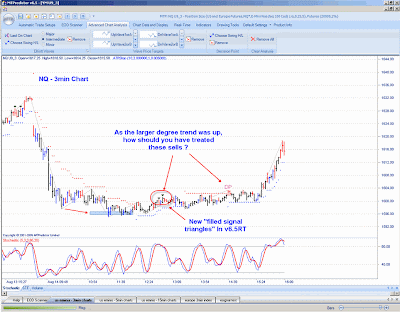
A look at the 3min NQ


Hi Everybody,

Today I would like to look at the NQ, particularly on the 3min chart to see how it evolved during the day yesterday.

First let’s start with the initial decline, notice how that stopped right at the extended Wave 3 WPT, this nailed the low of the day for you !

Then we had a good looking TS3 sell, and yes (after the initial sharp fall) the chart looked bearish, so taking this sell was OK. However, this was stopped out for a -1R loss. Yes, we all know loses can and do happen, but this loss was kept small and under control, so you were doing your job well here.

But, it is what happened next that I would like to focus on............ particularly how you view a market that rallies past the typical wave C WPT, what does this mean ?

Onto the next post,

Steve

Thursday, 27 August 2009

Now for the Advanced Traders............


For the more Advanced Traders among you, there was a nice high volume (VSA) spike trade off the low as the 3min ES reversed at DP support on a high volume red bar. The ES then rallied to the opposing DP for a nice +2.9R Profit (ignoring slippage and commission)

A nice extra trade yesterday for the more Advanced Traders among you....

Thanks, Steve

Then the ES

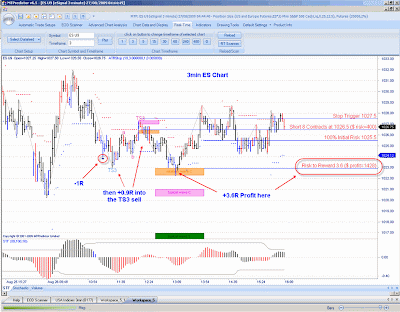
As I said, I deliberately chose the worst example for the 3min YM in the last post, for example, the 3min ES was much better, with 3 trades, -1R, +0.9R and +3.6R, see chart
These signals are in the new MTPredictor v6.5RT, so may be slightly different (we have improved the routines slightly) than the old RT add-ons.
Again, I do not suggest taking all the trades blindly without due consideration of the larger degree trend....
Thanks, Steve

The importance of correct position sizing...

Hi Everybody,

In the first example today I would like to stress the importance of using correct position sizing in all your trades. Here I have deliberately found the worst run of trades on the US e-minis yesterday to demonstrate this. There are not many Gurus who deliberately use bad examples, but then very few are truly interested in showing you how the markets really unfold.

Here we had 4 automatic trades on the 3min YM yesterday, 3 were losers and 1 a profit. The amateur traders will look at that and say, that is not good, but the amateur does not understand correct position sizing and how by keeping the losses small, at only -1R each and the profits large, at +4.2R in this example that even with more losing trades they should have made money overall.

Losses can and do happen in the real world, this is why it is so important to keep these inevitable losses small and under control....

But this was the worst example yesterday chosen just to show this point, I do not suggest taking all the trades without consideration of the larger degree trend.

Thanks, Steve

Wednesday, 26 August 2009

A look at the 3min ES – Part 3


All professional traders should also keep an eye on “related” markets. At the same time as the ES was making its low, the 3min YM was also making a very good looking Wave 5 low. Notice the clear clean 5-wave pattern as well as high volume (VSA) bars helping confirm the reversal at the Typical Wave 5 WPT. This nailed the low for you perfectly...............

Again, this show how powerful MTPredictor is, but only when you have taken the time and made the effort you study and learn........

Steve

A look at the 3min ES – Part 2


As the larger degree trend was down, it was still a good idea to keep looking for sells. Then (for users of the full MTPredictor v6.0 program), a Wave 5 high unfolded just before lunch. Wave 5 should be considered more of an Advanced technique, but do you all see how this “fitted in” with looking for sells yesterday.

Yes, “traditional” EW analysis says that 5 wave is “impulsive”, so the trend is up, BUT (from my own experience) I have found that many times (as in this example) it can be a correction. Yes, in this example the ES decline off this Wave 5 high to just below the start of the 5-wave sequence, into the DP where a low unfolded. This is why I treat waves “in isolation” just for low risk trade opportunities. I believe trading is about making money and not for discussing what is or is not technically correct. I leave that for the armchair Elliott Wave so called experts who are more interested in theory rather than actually making money.

So the end result – a nice +4.9R Profit (ignoring slippage and commission).

Steve

A look at the 3min ES – Part 1


Hi Everybody,

Today I would like to have a look at the 3min ES throughout the whole day to show you how a professional trader looks at a market during the day.

As always, let’s start with the larger degree trend, and in the 15min Charts (not shown, you can look at these for yourself) the high of the day was at DP resistance, so this set the trend to be down off that DP. So shorts were the order of the day. This 15min DP can also been seen on the 3min Chart, as you can see, this nailed the high of the day for you !!

Then, about mid morning, a TS3 sell unfolded. However, the market did not decline as anticipated and this would have results in a -1R loss. Yes losses can and do unfold, this is just part of trading. Anybody who tells you that losses do not unfold is lying ! The trick is keeping them small at just -1R.

Then.............. onto the next post

Steve

Tuesday, 25 August 2009

How the 3min Charts “fitted in” to the 5min


But what I found the most interesting of all, was how these two 3min TS3 sells (abc corrections) unfolded at Wave (2) and Wave (4) corrections on the 5min Chart. With the low of the day at the minimum Wave 5 WPT, this all “fitted together perfectly.............

Notice how there was a nice DP sell, that nailed the high of the day for you. The ES (3 and 5min) had the same, so that could have netted yet another massive profitable trade for you yesterday...........

So all in all, yesterday was a massive day. But then this was only to be expected as the e-minis have been quiet for the last few days so we were overdue for a massive day. This is why I talk so much about the Cyclical Nature of Trading. I just hope you all had the patience and disciple to wait and then make the most of yesterday, as the trades were there for you !

Steve

Then, later in the day, another TS3 sell appear. The difference here was that the STF was weak, so you should only have looked to the first profit target.

This was OK, as it brought in another +2.8R Profit (ignoring slippage and commission)

Steve

What a day !!


Hi Everybody

What an amazing day yesterday on the US e-minis. With so many great, and hugely profitable, trades, it is hard to know where to start.

The 3min YM was the star of the day with 2 beautiful sells on the 3min Chart. The first of which declined nicely into the Typical Wave 3 WPT target zone. The Advanced Traders among you would have know to start to lock in profits (by trailing your stop) at this level, especially when this was locking in a massive profit of over +8R (ignoring slippage and commission)

But the YM did not stop there............... next post.

Steve

Monday, 24 August 2009

Don’t forget the 5min Charts


Hi Everybody

A couple of weeks ago I reminded you all not to forget the 5min Charts, well Friday was a good example of this. The 3min Charts on the US e-minis were slow, but the 5min NQ gave us a buy signal that nailed the low early afternoon perfectly.

Yes there was a small (-1R) loss earlier as the NQ was dropping into the low. I hope you will all like the new “Historical signals” feature of the new MTPredictor v6.5RT once it has been launched...... Anyway, once the long trade was filled, the 5min NQ started to rally nicely. The only question came as an “opposing” sell appeared later in the day. As I have already said, “if” you are already in a good position that is “with” the larger degree trend, it makes no sense to want to swap to a weaker position that is “against” the larger degree trend”. Therefore, this sell should have been ignored.

The 5min NQ, then reached the DP (from the prior wave b high), where a high volume (VSA) bar unfolded. This was the signal to tighten stops. The result, was a +2.7R Profit (ignoring slippage and commission), adding this to the -1R loss from earlier in the day, and overall Friday on the 5min NQ should have been profitable.

Thanks, Steve

Friday, 21 August 2009

Another quiet day.......


Hi Everybody,

Phew, after all the excitement and huge profits on Wednesday, Thursday was a lot quieter. Again, this is just the Cyclical Nature of Trading at work

Thanks

Steve

Thursday, 20 August 2009

TS4 at the end of the day......


So far so good on the NQ with a massive +9.8R Profit late morning, but the NQ did not stop there.

As you can see, we got a nice TS4 buy later in the day for another +2R Profit (ignoring slippage and commission).......... Add this to the +9.8R and -1R trades from earlier and the 3min NQ had a massive day yesterday.................

Again, this is a perfect example of how the Cyclical Nature of Trading works out. After a few hard and tricky days, we then have a massive profitable day...

Thanks

Steve

Check the details.....


In the last post you say how we have two history signal triangles just before our winning TS3 long trade. So does that mean two -1R losses. No, that is why you need to use the Analysis commentary to take a look at the signals.

When you do this you will see that the first long trade was not stopped out when the second triangle came in, so this would only have been one trade and one -1R loss.

Please see this help video Click Here for more info, but these are “filled” MTP trades, not “failed” trades, so you need to check the details to see what actually unfolded.

The History Signals are a new feature in the upcoming V6.5RT version of MTPredictor.........

Thanks

Steve

Well I did say :-)

Hi Everybody,

Well just yesterday I did say that we were overdue for a good day on the US e-minis, and the 3min NQ gave us just that.

To start with I would like to look at the TS3 buy that unfolded late morning. As you can see, this got you long just before a sharp rally. As the STF has exceeded its strength band, the ATRStop was used for trade management. The result was a massive +9.8R Profit (ignoring slippage and commission). What a brilliant trade and shows how amazing the Cyclical Nature of Trading is, and why after a few quiet days we then get such a massive profit like this.

I hope you were all ready and as such made the most of this one :-)

Thanks

Steve

Wednesday, 19 August 2009

The Cyclical Nature of Trading again....


Hi Everybody,

Isn’t the Cyclical Nature of Trading amazing... After a horrible choppy and sideways day on Monday, we get a nice TS4 buy on the 3min YM yesterday (Tuesday). As you can see (using the standard trade management guidelines) this made a nice +3.5R Profit (ignoring slippage and commission) at the first projected target. Although this was not a huge profit, it was a profit.............

But the reason I mention the Cyclical Nature of Trading is that we are now overdue for some nice good and big profits. We have had a period of frustration when the markets have been tricky, and it is typically now that most amateurs get frustrated and give up. BUT, as we have seen so many times before, it is now that the best trades unfold.

A wise old Chinese proverb says “it is darkest just before dawn”, meaning, just when the amateur traders give up, is when the good trades come through. This is why I talk so much about the Cyclical Nature of Trading so you all understand how markets really unfold, and why you should not get frustrated just because the market has had a few hard and quiet days.............

So let’s see how the next few days unfold......

Steve

Tuesday, 18 August 2009

A day to avoid............


Hi Everybody,

Yesterday was a day to avoid on the US Indices. As you can see, all they did was chop sideways in narrow swings. Very very hard to trade days like this, so are best avoided...........

Steve

Monday, 17 August 2009

What about the sells ?


Likewise, if the current 15min trend was now up, what should you have done about the 3min NQ sells ?

As I always say, if in doubt or the picture does not look clear, then avoid and pass on the trade. Counter trend trades are only for Advanced Traders then them only if they have a good reason (like a very good looking pattern). These sells on the 3min NQ were not good looking at all, and as such were best avoided.........

But I agree, Friday was not an easy day on the US e-minis. But then this is just another example of the Cyclical Nature of Trading at work....

Thanks, Steve

A test of your nerve...........


After my comments in the post below, can you see how the DP on the 3min YM was one that you could have therefore considered........

But this was defiantly a hard one to manage and a test of your nerve as it basically chopped sideways for hours before finally rallying late in the day

Thanks, Steve

15min ES on Friday


Hi Everybody,

Friday was a tricky day on the US indices if you were not up with your 15min Charts. The one that was of main interest to me was the 15min ES, where the 15min DP supported the low and provided a platform off which a rally late in the day unfolded. So this changed the prior down trend to an uptrend for the shorter term charts.

Yes, this picture was not as clear on the other e-minis, but the 15min ES did find support at this DP, so you should, have been wary about shorts and looking for longs on the other e-minis as well. Even if there are minor differences in the individual e-minis, they are basically all related, so larger degree trends (if the 15min charts are similar) can "generally" apply to all 4 .....

Thanks, Steve

Friday, 14 August 2009

TS4 buy on the 3min ES


As the larger degree trend was up yesterday, this TS4 buy on the 3min ES was a good one to take............ But the only questions came as opposing sells appeared as the ES rallied. This brings up a goods question on when and when not to take opposing trades. I use a check list. First, what is the larger degree trend ? and second, are you already in a good trade?

On the ES long, the TS4 was already in the direction of the larger degree trend so it made no sense to swap a strong trade that is already with the larger degree trend for potentially weaker trades that were against it. So in a case like this I say, stick with the original trade and go with the larger degree trend. The result, a nice +3R Profit (ignoring slippage and commission).....

But how was the YM sell below post (that was against the larger degree trend) different? Well, because we were flat (no trade) so a clean decision could be made on the entry. Then the trade was protected quicker (100% initial risk).

Thanks and I hope this helps show how a view on the larger degree trend can help you on your trade decisions,

Steve

Advanced VSA sell on 3min YM


As the larger degree trend was up yesterday, most traders should have been focusing on long trades. BUT, and this is only for the Advanced Traders among you. There was a classic and perfect high volume (VSA) sell at DP resistance on the 3min YM at around 1:00pm EST.

This was a perfect example of how a market broke above old highs only to stop dead at our DP resistance and all on a high volume spike. A classic “fake out” by professional traders, and the sign for a sharp reversal.

The reason I say that this was for the Advanced Traders among you was because it was “against” a larger degree up trend, so you should have protected the trade quicker (using the 100% initial risk level). But this short trade declined past the initial support zone and found a low as the TS4 buy (next post) on the ES came in. The result, a nice +4R Profit (ignoring slippage and commission)

Thanks, Steve

Lovely DP open play on the 3min ES


Hi Everybody,

I hope you all have not forgotten to use the DP on any move from just after the open on the US e-minis. If you look at this 3min ES chart, you can see how the ES declined just after the open but ran into DP support. This was also at the Typical Wave C WPT support zone as well. This then nailed the very low of the day for you !

The ES then rallied into the “opposing” DP for a very nice +3.9R Profit (ignoring slippage and commission). A very nice start to the day.

Yes this was a slightly Advanced Trade, but it is one that I have looked at many times before.....

Thanks, Steve

Thursday, 13 August 2009

FOREX – CADUSD 240min Chart


Hi Everybody,

This is a follow up on a post Tony made to the Forum on the CADUSD – please see
http://www.mtptrader.com/showthread.php?p=19969#post19969 where Tony highlighted that the CAD was at the maximum Wave 5 WPT and as such was at a high risk area for a high to unfold.

Well, that nailed the high perfectly and the CAD has declined nicely since.....

So this was a great example of a FOREX trade called “at the time” by Tony on the Forum :-)

Thanks, Steve

Wednesday, 12 August 2009

FOREX – GBPUSD 240min


Hi Everybody,

I would just like to remind all the FOREX traders among you not to forget the longer time frames. We suggest 60min, 240min and 480min for FOREX, as these longer time frames give smoother charts.

A great example is the recent TS3 buy on the GBPUSD on a 240min chart that caught the rally up into the 170 area....

A note for the Advanced Traders among you. When this trade reached the Maximum Wave 3 WPT (purple zone) “and” you were sitting on a +8R Profit what do you think would be the sensible course of action ? Exactly, tighten stops as this move was likely nearing an end. This is exactly what happed with the high unfolding right at the maximum Wave 3 WPT...

Thanks, Steve

Not all trades work out.....


Unlike most Gurus I do talk about the bad and hard trades. This is important so it gives you a balanced view of how trading unfolds in the real world, it is also important as there is so much B.S. (if I can say that :-) ) in this industry.......

So here is a TS3 sell on the 3min NQ that did not work out as anticipated. At worst it would have been a -1R loss (which is still smaller than the +2R Profit on the 3min YM), and at best a break-even trade. But the important point is that it did not work out as anticipated.

This is an important point, not all trades work out, loses can and do happen, your job as a trader is to keep the losses small at those times.

Thanks, Steve

The Cyclical Nature of Trading..... Again !


Hi Everybody,

We should all know about the Cyclical Nature of Trading by now, but it is always work reminding you all. Yesterday was a quiet day on the US e-minis with few trades. This is OK, because this comes on the back of some very good days recently. This is just because we have now entered the quiet period of the cycle. It will not be long before we get back to the profitable part. Again, this is just the natural way Profits and losses unfold in the markets

The YM did give us a small +2R Profit (ignoring slippage and commission) on the 3min Chart, but overall it was a quiet day yesterday.....

Thanks, Steve

Tuesday, 11 August 2009

Size matters.......


Hi Everybody

The 3min Dax this morning has just shown us a perfect example of why correct position sizing works and why it is so important to keep your losses small.

Here we had two losing DP sell’s as the DAX continued higher, but then on the 3rd sell the market collapsed. As you can see from the chart, this 3rd trade netted a massive profit of approx. +7R Profit (ignoring slippage and commission). Now compare that to the two losses earlier at only -1R each. So 3 trades, 2 losses and 1 profit but overall you ended up with a massive profit....

This is what amateur traders do not understand, they seem to only strive for a high % of winners, not understanding that you don’t have to win on all trades to make money overall. Here we had more losses than winners and still came out with a huge profit overall.

This is what separates the losing amateur with the successful professional, the understanding what is important in trading, and that is to keep losses small (not avoid them).

Steve
PS, this was taken using a Beta copy of the new MTPredictor v6.5 RT that has history trades shown by small triangles on the chart. Click here for a video on this new feature.

15min YM Wave C low


Here is the 15min YM chart. As you can see “at the time” of the 3min DP buy, the 15min chart was right at the minimum Wave C WPT support zone.

Thanks, Steve

3min YM DP buy


Hi Everybody,

Today I would like to remind you all to always keep an eye on the longer terms charts (15min for 3min entry). The DP buy on the 3min YM at 14:18 EST was a great example of this.

Normally we are cautious of DP’s because they can “creep”, but they are OK when they fall at “larger degree” support or resistance, so when this DP buy came up you should have had a quick look at the 15min chart. As you will see in the next post, the 15min “at the time” was right at the minimum Wave C WPT for a potential support, as such, the 3min DP was a good one to take....

As you can see, this nailed the very low of the day for you ! The YM then rallied nicely into the first projected profit target, but the STF was strong (exceeded the strength band) so it was time to swap to the ATRStop to look to run the trade. This held the long into the close for a very nice +6R Profit (ignoring slippage and commission).

So this is why I say to always keep and eye on the longer term charts for potential support / resistance zones.....

Thanks, Steve

Monday, 10 August 2009

Advanced Analysis....


Hi Everybody,

As the new MTPredictor V6.5 RT is getting closer to release I thought I would remind you all of how the Advanced Traders among you can use some of the more advanced tools and modules in the current V6.0 to help find additional trade setups. Here is a good example on the 5min YM, that nailed the high of the day for you on Friday.....

As you can see, the high unfolded at the minimum wave 5 WPT. But I also like how this was on a high volume (VSA) spike as well. This was a classic “blow off” top formation, where the move to new highs on very high volume failed and was just a “fake out” by the professional traders....

Please remember, that the Elliott module is an advanced technique. For Wave 5’s please see the Wave 5 help video at:
http://www.mtpredictor.com/support/V6.php (bottom of the page).

The 5min YM then declined into the DP (from the prior Wave 4 low) perfectly for a nice +4.8R Profit (ignoring slippage and commission)

Thanks, Steve

Friday, 7 August 2009

3min YM +4R Profit


Hi Everybody,

It was not all hard work on the US e-minis yesterday. The trend on the 15min YM was down to flat yesterday so the TS3 sell early afternoon on the 3min YM was a lot easier to take with confidence.

This resulted in a nice +4.6R profit (ignoring slippage and commission).

So there were some much easier trades yesterday on the US e-minis

Thanks, Steve

Profits and loses.....


I just want to remind you all that there will always be loses as well as Profits in any trading. We show these are small triangles on the charts in the RT add-ons. We will be adding this feature in the new MTPredictor v6.5 RT soon.....

But the important point is that the losses are kept small. Three -1R losses here are still such small than just one of the +4R or +5R profits yesterday. This is what amateurs don’t understand, it is not the number of profits and losses (win %) that is important, it is their size. Here 3 losses at -3R total was still much small than just two profits at +9R total. Professional know and understand this, amateurs need to learn this......

Thanks, Steve

3min NQ – TS3 sell later in the day


Unusually, the best trades yesterday on the 3min NQ were “against” the larger degree trend. This is rare but as long as they are managed more aggressively, they can still be nicely profitable. For example a nice +4R Profit later in the day on this TS3 sell.

Normally the best trades are “with” the larger degree trend, but the market does not always work perfectly in the way we want. The idea of “knowing” the larger degree tend is helping you be more aggressive or not in your trade management.

Amateurs expect the markets to work 100% as they expect, the truth is a long way from this. Successful trading is about risk control and trade management, and not trying to “predict” the future, the market will always be right, we will not, so it is better looking at what we can control, and that is our initial risks and trade management. This is what professional traders focus on, what they can control and not worrying about what they cannot :-)

Thanks, Steve

3min NQ – TS1 sell


Hi Everybody,

Today I wanted to answer a few questions on the 3min NQ, and in particular how to manage trades that are “against” the larger degree (15min) trend.

The day started well yesterday with the DP resistance nailing the high of the day for you ! But later in the morning a nice TS1 sell unfolded. For the Advanced Traders among you, as this was against larger degree (15min) DP support you should have moved your stop to break even quicker, using the 100% initial risk guideline. This is what I was looking at in my Advanced Customer Training webinar on Wednesday.

The result was a nice +5R Profit (ignoring slippage and commission). So yes there can be good trades against the trend, but you must manage than more aggressively as you are against the main trend.

Thanks, Steve

Thursday, 6 August 2009


Here is the 15min ES chart. As you can see, the 3min VSA setup fell right at larger degree 15min DP support................ Making the 3min a good setup

Thanks, Steve

VSA – High volume spike


Hi Everybody,

I was asked about the high volume spike (VSA) indicator in MTP v6.0 in my Advanced Strategies webinar yesterday. Well, there was a brilliant example of this that nailed the very low of the day in the 3min ES yesterday.

As you can see, not only was this on a VSA bar but it also on Stochastic and STF divergence. Remember we need the bar “after” the VSA bar to find support or resistance at DP or WPT levels. Here the DP nailed the very low of the day for you !

But, and this is the big but, this was also perfectly “in line” with the larger degree (15min chart) as the 15min ES was right at DP support at this time as well. Please see the next post.

What a great example of the VSA indicator in MTPredictor v6.0

Steve

Wednesday, 5 August 2009

Don’t forget the longer term charts


Hi Everybody,

Today I would like to remind you all again not to forget the longer term charts. When day trading it s all too easy to get hung up on the 3min charts and then forget the 5min. But you can get some great setups on these, for example 3 out of the 4 US e-minis gave a buy setup on the 5miin chart just before the run up into the close yesterday.

Here is the trade on the 5min ES, as you can see, the result was a nice +3R Profit (ignoring slippage and commission) as the ES rallied strongly into the close. So a nice trade to catch :-)

Thanks

Steve

Tuesday, 4 August 2009

+13R Profit in the 3min FTSE


Hi Everybody,

Just because the US e-minis are having a quiet time does not mean that all markets are the same.

Here is a massive +13R Profit (ignoring slippage and commission) on the 3min FTSE that was posted by Tony on the Forum.

Steve

Daily S&P Update


Hi Everybody

Looks like we are still in the DP zone, so the S&P has not finished making its "decision" on whether it is going to reverse or push higher....

But this reminds me a lot of late 2002, when the markets were rallying off the lows. It is all too easy to get a bit too excited and want to pick the next high, because you don’t want to miss out on the next big fall.

BUT, and this is a big but, because the fall has recently happened the "probabilities" are that a recovery will now unfold rather than another big fall.

Precter and many other big EW Gurus fell into this same trap last time and were continually calling for a top as the S&P rallied for the next few years.

So yes, trade your own system, but just be aware that a major low may have been made in March and as such the markets may now be in a new major up trend...............

Steve

YM – TS3 buy on VSA spike


Here is a good example of how you don’t need to “predict the future” to make money. This TS3 buy was “against” the larger degree trend “at the time” so the Advanced Traders among you should have used the 100% initial risk guideline to protect the trade quicker......

But what I liked about this setup was the nice symmetrical ABC pattern (much better looking than the ES one)going into the TS3 buy as well as the high volume (VSA) spike at the low. This made this a good one for the Advanced Traders among you to consider.....

The projected profit target then nailed the very high of the day for you ! for a nice +2.3R Profit (ignoring slippage and commission)

You have to remember that we are in the hard part of the cycle at the moment, it will not be long before we come back to the part when we get some easier trades and bigger profits.

Thanks, Steve

ES – 15min Chart


Here is the 15min ES chart “at the time”, as you can see it did look “at the time” that the ES had turned down off DP resistance and as such the 15mion trend had now turned down. Therefore the 3min TS3 sell “at the time” was in the direction of this larger degree trend.

Again, most Amateurs simply do not understand that any analysis cannot be right all the time. Successful trading is about dealing with probabilities and keeping losses small when the trade does not work out as anticipated. Successful trading trading is not about trying to predict the future, it is about Risk control, and keeping the losses small and Profits large.

I still find it amazing the way so many amateur traders simply cannot understand this basic principle of successful trading.......... I guess that is why 97% of Amateurs fail...

Thanks, Steve

ES – TS3 sell, a -1R loss


Hi Everybody,

Again, unlike most Gurus and software developers, I look at the hard times as well as the losses. A good example was the TS3 sell around Lunch time on the 3min ES.

As you can see, this would have resulted in a -1R loss. Yes it was valid as it was “in the direction of” the larger degree 15min trend (next post), that had just reversed off DP resistance. My only concern was that the ABC pattern was not very “symmetrical”, the wave b swing was far too short in time to “look good”.

Most amateurs don’t understands that losses can and do happen, that is why we have stops in place and keep the loss small at just -1R. Again, this is all part of the Cyclical nature of Trading, and how we are now in the hard part of the cycle, after the massive profits mid last week. This is just how the markets and Profits and losses unfold in the “Real World” ......

Thanks, Steve

Monday, 3 August 2009

TS3 buy on the 3min NQ on Friday


Unlike most Gurus, I also talk about the harder trades as well as the loses. This is important so you all have a balanced view of how trading unfolds in the real world. This TS3 buy on the 3min NQ on Friday was a good example.

Although the long trade exceeded the 100% initial risk level, the larger degree trend (on the 15min Chart) did look to be up at the time. So you could very well have decided to leave the stop at the original position. As such this would have been a -1R loss. But (and this is the important point), the loss would have been small and controlled. A -1R loss when compared to even the +2.5R Profit on the ES is small. And just remember the Profits of +6R and +8R from mid last week. That is what successful trading is all about, keeping the inevitable loses small and under control.

Thanks

Steve

DP sell on the 3min ES on Friday


Hi Everybody............

Another quiet day on Friday with few signals. But as I said last week, this is just part of the Cyclical Nature of Trading, and comes on the back of some massive profits mid last week.

I did receive a question on the DP sell late in the day on Friday. Normally I say that DP’s should only be taken if they fall at larger degree support or resistance of if they are after 5 swings. But this was neither on the 3min Chart.

However, the Advanced Traders among you should have spotted that this was also on a high Volume (VSA) spike, as such it was a trade that the Advanced Traders among you could have taken.

Thanks

Steve